

When I began to work with Windows 10, I was able to shut the laptop down without Googling to find the power button icon; a great improvement over Windows 8. My next interest was determining what to do when the OS falls over, generating a Blue Screen of Death. This article will describe how to set your system up so that, when it does, you’ll be able to find the cause of most crashes in less than a minute for no cost.

In Windows 10, the Blue Screen looks the same as in Windows 8/8.1. It’s that screen with the frown emoticon and the message “Your PC ran into a problem . . .” This screen appears more friendly than the original Blue Screens, but a truly friendly screen would tell you what caused the problem and how to fix it; something that would not be difficult since most BSODs are caused by misbehaved third party drivers that are often easily identified by the MS Windows debugger.
+ For earlier versions of the OS, refer to the following:
Windows 8: (Article) How to solve Windows 8 crashes in less than a minute
(Slide show) How to solve Windows 8 crashes
Windows 7: Solve Windows 7 crashes in minutes
Windows XP/2000: How to solve Windows crashes in minutes
Just to be clear, this article deals with system crashes, not application crashes or system hangs. In a full system crash, the operating system has concluded that something has gone so wrong (such as memory corruption) that continued operation could cause serious or catastrophic results. Therefore, the OS attempts to shut down as cleanly as possible – saving system state information in the process – then restarts (if set to do so) as a refreshed environment and with debug information ready to be analyzed.
- Why Windows 10 crashes
- What is a
- Configuring Windows 10 to generate the right memory dump
- What are symbols and why you need them
Contents
Why Windows 10 crashes
To be sure, Windows has grown in features and size since its introduction in 1985 and has become more stable along the way. Nevertheless, and in spite of the protection mechanisms built in to the OS, crashes still happen.
Once known as the Ring Protection Scheme, Windows 10 operates in both User Mode(Ring 3) and Kernel Mode (Ring 0). The idea is simple; run core operating system code and device drivers in Kernel Mode and software applications and user mode drivers in User Mode. For applications to access the services of the OS and the hardware, they must call upon Windows services that act as proxies. Thus, by blocking User Mode code from having direct access to Kernel Mode, OS operations are generally well protected.
The problem is when Kernel Mode code goes awry. In most cases, it is third-party drivers living in Kernel Mode that make erroneous calls, such as to non-existent memory or to overwrite OS code, that result in system failures. And, yes, it is true that Window itself is seldom at fault.
Where to get help with Windows 10 crashes
There are plenty of places to turn to for help with BSODs, a few of which are listed below. For example, ConfigSafe tells you what drivers have changed and AutorunCheck tells you what Windows Autorun settings have changed. Both help nail the culprit in a system failure. And everyone should have the book Windows Internals; it is the bible that every network admin and CIO should turn to, especially Chapter 14 “Crash Dump Analysis,” which is in Part 2 of the book.
When I asked Mark Russinovich, one of the authors, why a network admin or CIO – as opposed to a programmer – should read it, he said, “If you’re managing Windows systems and don’t know the difference between a process and a thread, how Windows manages virtual and physical memory, or how kernel-mode drivers can crash a system, you’re handicapping yourself. Understanding these concepts is critical to fully understanding crash dumps and being able to decipher their clues.”
So, while WinDbg provides the data about the state of a system when it fell over,Windows Internals turns that cryptic data into actionable information that helps you resolve the cause.
WHERE TO FIND BSOD HELP
| Name | Type | Location |
|---|---|---|
| About.com | Guide: | http://pcsupport.about.com/od/fixtheproblem/ht/stoperrors.htm |
| AutorunCheck | Tool: | http://imaginelan.net/autoruncheck-home/ |
| CNET | Form: | http://www.cnet.com/forums/windows-10/ |
| ConfigSafe | Tool: | http://imaginelan.net/configsafe-home/ |
| Experts-Exchange | Help Site: | http://www.experts-exchange.com/topics/windows-10/ |
| FiretowerGuard | Tool: | http://sampansecurity.com/firetowerguard.html |
| Windows 10 Forums | Forum: | http://www.windows10forums.com/ |
| Microsoft Autoruns | Tool: | https://technet.microsoft.com/en-us/sysinternals/bb963902 |
| Microsoft DaRT | Tool: | http://www.microsoft.com/en-us/windows/enterprise/products-and-technologies/mdop/dart.aspx |
| TechNet | Forum: | https://social.technet.microsoft.com/Forums/en-US/home?category=Windows10ITPro |
| TenForums | Forum: | http://www.tenforums.com/ |
| WhoCrashed | Tool: | http://www.resplendence.com/whocrashed |
| WinDbg | Tool: | http://msdn.microsoft.com/en-us/windows/hardware/gg463009.aspx |
| Windows Internals | Book: | http://technet.microsoft.com/en-us/sysinternals/bb963901.aspx |
| WindowsSecrets | Forum: | http://windowssecrets.com/forums/forumdisplay.php/68-Windows-10-Forum |
What is a memory dump?
A memory dump is a copy or a snapshot of the contents of a system’s memory at the point of a system crash. Dump files are important because they can show who was doing what at the point the system fell over. Dump files are, by the nature of their contents, difficult to decipher unless you know what to look for.
Windows 10 can produce five types of memory dump files, each of which are described below.
1. Automatic Memory Dump
Location:%SystemRoot%\Memory.dmp
Size: Size of OS kernel
The Automatic memory dump is the default option selected when you install Windows 10. It was created to support the “System Managed” page file configuration which has been updated to reduce the page file size on disk, primarily for small SSDs, but will also benefit servers with large amounts of RAM. The Automatic memory dump option produces a Kernel memory dump; the difference is when you select Automatic it allows the SMSS process to reduce the page file smaller than the size of RAM.
To check or edit the system paging file size, go to the following:
Windows 10 button | Control Panel | System and Security | System | Advanced system settings | Performance | Settings | Advanced | Change
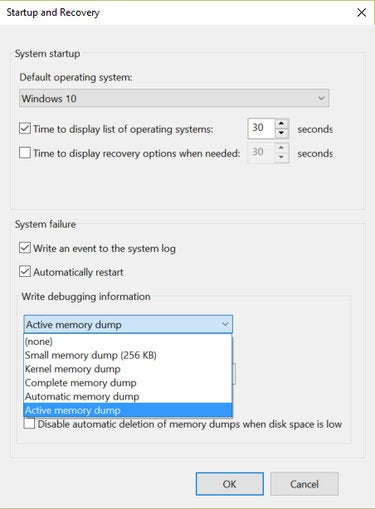
2. Active Memory Dump
Location: %SystemRoot%\Memory.dmp
Size: Triple the size of a kernel or automatic dump file
The Active memory dump is a recent feature from Microsoft. While much smaller than a complete memory dump, it is probably three times the size of a kernel dump. This is because it includes both the kernel and the user space. On my test system with 4GB RAM running Windows 10 on an Intel Core i7 64-bit processor the Active dump was about 1.5GB. Since, on occasion, dump files have to be transported I compressed it, which brought it down to about 500MB.
3. Complete Memory Dump
Location: %SystemRoot%\Memory.dmp
Size: Installed RAM plus 1MB
A complete (or full) memory dump is the largest dump file because it includes all of the physical memory that is used by the Windows OS. You can assume that the file will be about equal to the installed RAM. With many systems having multiple GBs, this can quickly become a storage issue, especially if you are having more than the occasional crash. Generally speaking, stick to the automatic dump file.
4. Kernel Memory Dump
Location: %SystemRoot%\Memory.dmp
Size: ≈size of physical memory “owned” by kernel-mode components
Kernel dumps are roughly equal in size to the RAM occupied by the Windows 10 kernel, about 700MB on my test system. Compression brought it down nearly 80% to 150MB. One advantage of a kernel dump is that it contains the binaries which are needed for analysis. The Automatic dump setting creates a kernel dump file by default, saving only the most recent, as well as a minidump for each event.
5. Small Memory Dump (a.k.a. a mini dump)
Location: %SystemRoot%\Minidump
Size: At least 64K on x86 and 128k on x64 (279K on my W10 test PC)
Minidumps include memory pages pointed to them by registers given their values at the point of the fault, as well as the stack of the faulting thread. What makes them small is that they do not contain any of the binary or executable files that were in memory at the time of the failure. However, those files are critically important for subsequent analysis by the debugger.
As long as you are debugging on the machine that created the dump file, WinDbg can find them in the System Root folders (unless the binaries were changed by a system update after the dump file was created). Alternatively, the debugger should be able to locate them automatically through SymServ, Microsoft’s online store of symbol files. Unless changed by a user, Windows 10 is normally set to create the automatic dump file for the most recent event and a minidump for every crash event, providing an historic record of all system crash events for the life of the system.
[“source -cncb”]