

Organizations are transforming their digital environments to increase agility and to operate more efficiently. We see this transformation in how customers migrate to the cloud and adopt cloud-native technologies and practices in their own environments. As their digital estates become increasingly more complex and critical to their business operations, it becomes even more important to effectively manage and monitor their applications and infrastructure.
Grafana is a popular open-source analytics visualization tool that allows users to bring together logs, traces, metrics, and other disparate data from across an organization, regardless of where they are stored. Last year, we announced our strategic partnership with Grafana Labs to develop a Microsoft Azure managed service that lets customers run Grafana natively within the Azure cloud platform. Today, we are announcing that Azure Managed Grafana is available in preview. With Azure Managed Grafana, the Grafana dashboards our customers are familiar with are now integrated seamlessly with the services and security of Azure.
Contents
Seamless connection across Azure data sources and beyond
The Grafana application lets users easily visualize all their telemetry data in a single user interface. With Grafana’s extensible architecture, users can visualize and correlate multiple data sources across on-premises, Azure, and multi-cloud environments. Azure Managed Grafana particularly optimizes this experience for Azure-native data stores such as Azure Monitor and Data Explorer thus making it easy for customers to connect to any resource in their subscription and view all resulting telemetry in a familiar Grafana dashboard.
Customers can preserve existing charts in the Azure portal that are used for monitoring. Through service-to-service integration, our customers can bring any chart in the Azure portal over to their Azure Managed Grafana instance with a one-click “pin to” operation thus automating the entire migration process.
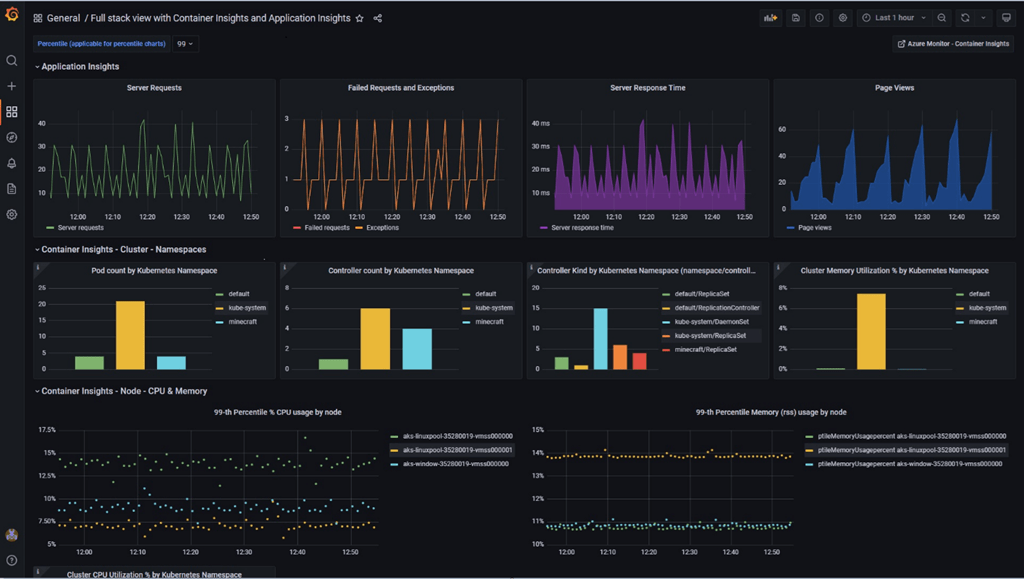
Azure Managed Grafana also provides a rich set of built-in dashboards for various Azure Monitor features to help customers easily build new visualizations. For example, some features with built-in dashboards include Azure Monitor application insights, Azure Monitor container insights, Azure Monitor virtual machines insights, and Azure Monitor alerts.
Secured access and sharing of Grafana dashboards with Azure Active Directory
In Azure Managed Grafana, customers can customize user permissions with specific roles and assignments stored in Azure Active Directory. These definitions are mapped transparently to Grafana’s internal roles, which enforces the actual access control. This integration enables both simplicity and consistency by allowing customers to manage users in their teams and authorize their use of a Grafana instance centrally through Azure Active Directory.
On the backend, Azure Managed Grafana can be configured to access Azure Monitor through a managed identity that was set up as part of the Grafana instance creation. Using this option, customers do not need to deal with another credential separately—though that is still possible if preferred.
[“source=os-system”]